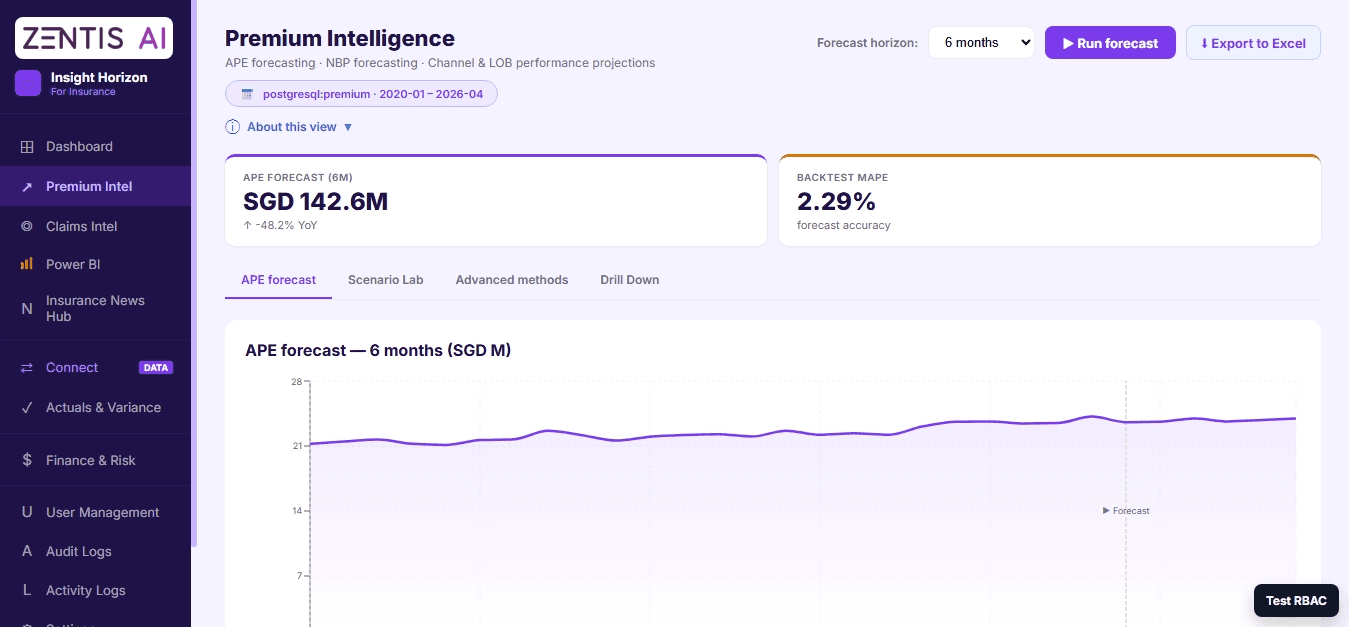
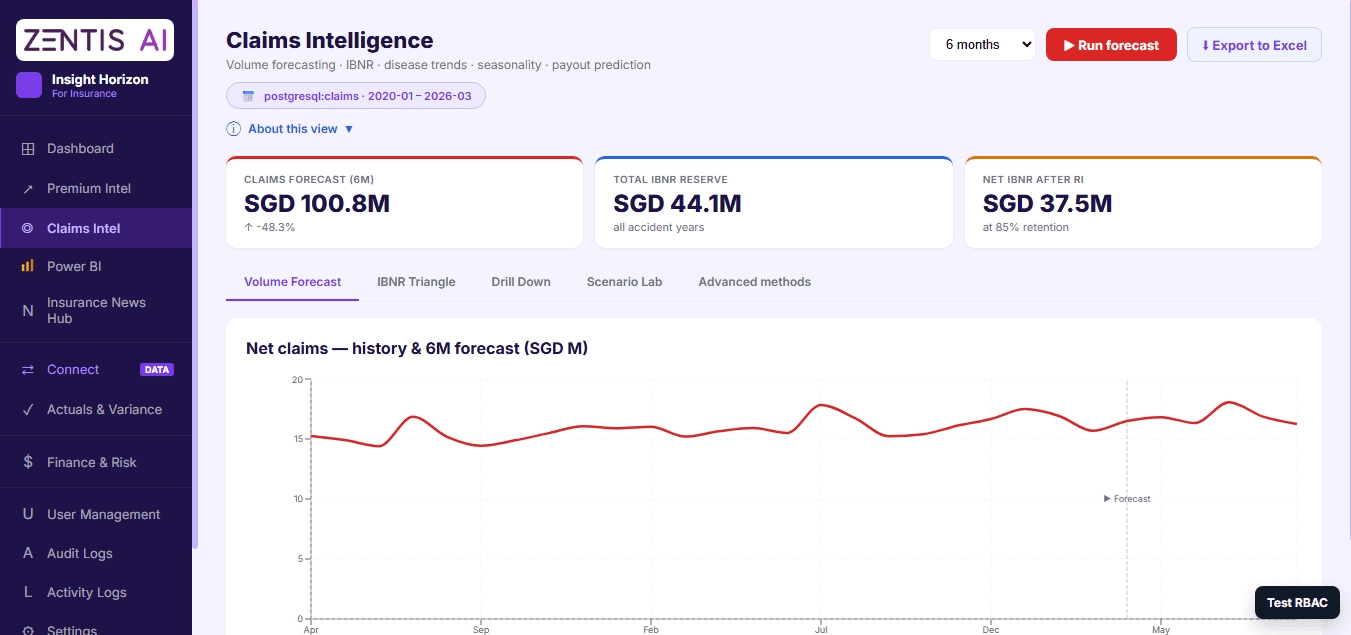
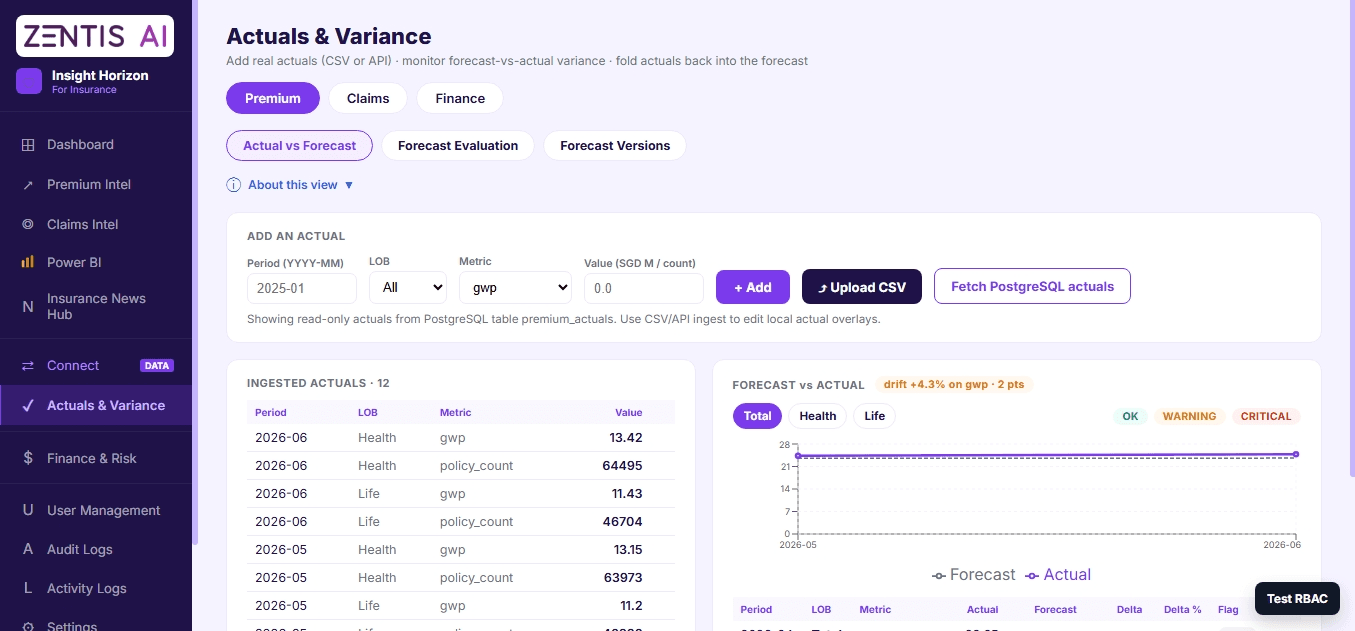
Zentis Analytics connects policy, claims, actuals, and risk into a single data core, so finance and actuarial teams stop reconciling systems and start reading the numbers.
Four connected modules, Policy Intelligence, Claims Intelligence, Actuals & Variance, and Finance & Risk Analytics, running off one live data core, with a Scenario Lab to stress-test assumptions before they reach a board pack.
Voice agents plug into the same core, so a customer conversation, a claim update, a policy question, feeds the same risk and reporting picture as everything else, instead of living in a separate system nobody reconciles until quarter end.

Forty five people across finance and actuarial, four systems that don't talk to each other, and a quarterly close that starts with export files and ends with someone manually checking whether the loss triangle in one system matches the premium figures in another. By the time the board pack is ready, everyone's confidence in the numbers is really just confidence that nobody found a mismatch this time.
From finance and actuarial teams across P&C, life, and reinsurance books.
Reconciling premium, reserving, and reporting across separate systems consumes weeks that should go to actually reading the numbers.
Multiple actuarial methods, run separately, with no single live view of where they agree or diverge.
The board pack gets built from last quarter's confidence in this quarter's numbers, because there was never time to check them properly.
P&C-specific language like loss triangles doesn't map cleanly onto a life insurer's forecasting reality, or a reinsurance broker's, and treating them the same erodes trust fast.
Not a feature list. The actual sequence, from the moment the quarter opens to the moment the board pack is ready.
Not batched at quarter end. The data that will eventually reach the board pack starts flowing from day one of the quarter.
Variance surfaces as it happens, not as a surprise during close week.
Chain Ladder, Bornhuetter-Ferguson, and Mack run together, with ODP bootstrap producing a 95th percentile range instead of one number presented as certain.
Holt-Winters, SARIMA, Theta, and Trend and Seasonality models, matched to how a life book actually behaves.
A variation gets run across every module first, so what reaches the board has already survived scrutiny.
Loss ratio, expense ratio, combined ratio, ready before the meeting, not the night before it.

Each one is a full module, not a feature. Together they're what makes one live core possible instead of four reconciled systems.
Live policy-level data, the wording in force, the endorsements, the coverage terms, feeding directly into forecasting and risk views instead of sitting in a policy admin system nobody else queries until something goes wrong.
Claims data connected to reserving and reporting the moment a claim is logged, not reconciled once a quarter. What used to be a separate export becomes part of the same live picture everything else draws from.
Actuals tracked against forecast continuously through the quarter, so variance is something finance notices as it develops, not something they discover the week the board pack is due.
Risk and financial reporting drawing from the same live core as the other three modules, so the number that goes to the board and the number the risk committee sees are, structurally, the same number.

Chain Ladder, Bornhuetter-Ferguson, Mack, and ODP bootstrap for P&C, run properly, not approximated.
Nine weeks of reconciliation becomes a board pack that's ready when the quarter closes, not two weeks after.
A reserve range with a stated percentile, not a single number nobody can defend if it's questioned.
Live policy-level data feeding directly into forecasting and risk views.
Claims data connected to reserving and reporting in real time, not at close.
Actuals tracked against forecast continuously, not reconstructed once a quarter.
Risk and financial reporting drawing from the same live core as every other module.
Stress-test assumptions across all four modules before they reach a report.
Chain Ladder, Bornhuetter-Ferguson, Mack, and ODP bootstrap with a 95th percentile range.
Holt-Winters, SARIMA, Theta, and Trend and Seasonality, matched to a life book's actual behaviour.
Customer conversations that understand context and feed the same reporting core.
| Dimension | Separate point solutions | Zentis Analytics |
|---|---|---|
| Data | Four systems, reconciled manually at close | One live core, all four modules draw from it |
| P&C reserving | Run separately, stitched in afterward | Chain Ladder, Bornhuetter-Ferguson, Mack, and ODP bootstrap, connected to the same core |
| Life forecasting | Often approximated with P&C-style tools | Holt-Winters, SARIMA, Theta, and Trend and Seasonality, purpose-built for the book |
| Assumption testing | Manual, usually after the fact | Scenario Lab, run before anything reaches a report |
| Close turnaround | Weeks, dominated by reconciliation | Days, dominated by review |
Illustrative, based on the shape of finance and actuarial workflows we've modelled. The real number depends on your book, your systems, and how it's configured.
Zentis Analytics deploys as SaaS, private cloud, on-premise, or fully air-gapped, the same options available across the rest of the platform. GDPR compliant, SOC 2 and ISO 42001 certified, regardless of which option you choose.
Describe the close process, and get a first draft of the team back in the same conversation.
Explore Zara →Platform · Zen StudioSet which actuarial methods apply to which book, node by node.
Explore Zen Studio →Platform · Zen PilotWatch the data core update in real time as the quarter progresses.
Explore Zen Pilot →